All posts by David Swart

High school science teacher

Toxins: Mass-Mole Conversions

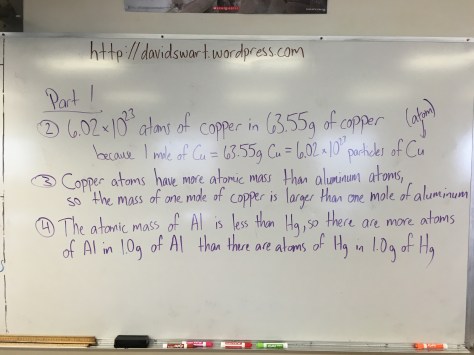
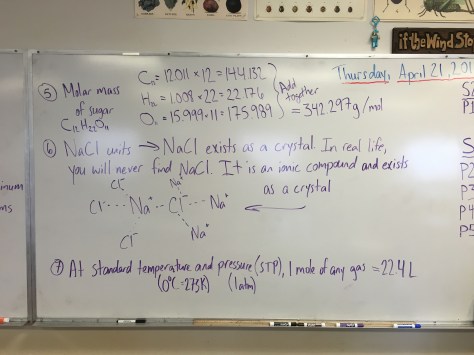
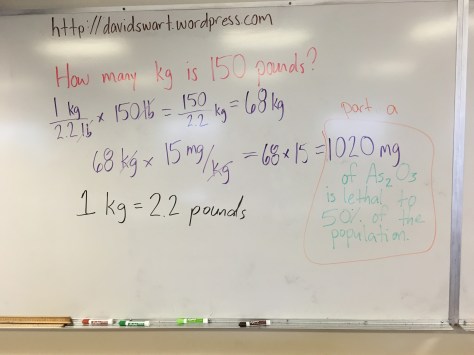
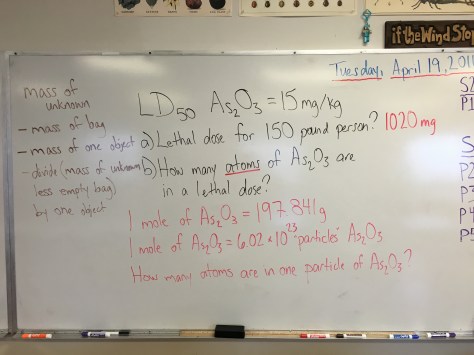
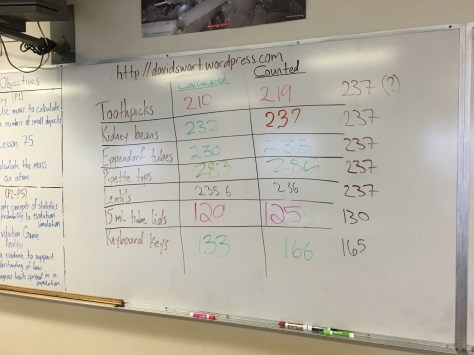
Lesson 78 provided students with additional practice converting from mass to moles and from moles to mass.  The Lesson 78 PowerPoint ChemCatalyst activity asked students to predict whether arsenic (As), arsenic oxide (As2O3), or arsenic sulfide (As2S3) was most toxic.  Students had to consider how many atoms of arsenic are in each molecule, and which has more molecules in a fixed mass.  Some of the work from the entry task is shown below:

For the Lesson 78 Worksheet, students worked in pairs to complete the questions.  For homework, students were assigned questions 5-8 from the textbook.

Toxins: Molar Mass

Today’s work began with the ChemCatalyst from the Lesson 77 PowerPoint.  Students considered the question for a few minutes and were once again reminded how abstract the idea of the mole really is.  To help bring the concept of the mole to life, students worked through the Lesson 77 Worksheet.  The worksheet consisted of two parts, with Part 1 asking students to work through some of the math behind calculating molar mass.  Then in Part 2, students participated in a lab activity where they were able to actually measure out and visualize what one mole of various materials look like.  Students worked with water, table salt, aluminum, nickel, and iron.  For homework, students were assigned textbook questions 5-7.

Answers for Part 1 are shown below:

IMG_0774IMG_0775

Evolution: The Beak of the Finch

After an eventful start to the day in which we briefly lost power at our school and our digital classroom wall clocks are hours off, we decided to start the class period with Jack Horner’s entertaining TED Talk in which he describes his research connecting dinosaurs and chickens.

After the video, we returned to our discussion of Darwin’s finches from yesterday’s lesson.  Students watched the HHMI video The Beak of the Finch (below) and then set to work on the accompanying worksheet packet.  We will continue our work tomorrow during the short Friday class period.  Students who finish early are encouraged to try the Finch Song Activity on the HHMI website.

Evolution: Retroviruses, Pseudogenes, and Transposons

Occasionally we need to learn content that involves a lecture-style delivery with students taking lots of notes.  Today was one of those days.  The PowerPoint includes content as well as links to the videos we watched.  Briefly, students were introduced to Linnaeus, Lamarck, and Darwin for some background information on how our understanding of evolution has changed over time.  We then transitioned into learning about concepts that help explain how the DNA available to an organism can change over time, and how changes in DNA can be used as a tool to track the relationships between species.  The videos embedded in the PowerPoint are also provided below:

Toxins: Avogadro’s Number

For Lesson 76, students gained practice working with scientific notation in the context of Avogadro’s Number (really big numbers) and the mass of small numbers of particles (really small numbers).  We began class by working through part B of the ChemCatalyst from Lesson 75.  Notes from the work are shown below:

We then transitioned into the Lesson 76 Worksheet (we did not use the Lesson 76 PowerPoint but it is provided here for reference).  We worked through some of the table on page 2 of the worksheet, and then students used the remainder of the class period to work together to complete the worksheet.  For homework, students were assigned to complete any 3 problems from the textbook.

Evolution: Mutations and the Birth and Death of Genes

As an entry task, students watched the HHMI video Mutations and the Birth and Death of Genes, which explains how icefish have evolved to live in the frigid waters of the Antarctic.

Students completed and turned in the icefish video worksheet after the video, and then transitioned to a review of our work from yesterday.  Using the Chromebooks, students navigated to yesterday’s post on the class website and analyzed the data, using their findings to write a summary paragraph explaining how the data provides evidence in support of the Theory of Evolution.  Instructions from the white board are shown below:

For students who would like to learn more about gene mutations (both the loss of gene function, as well as when genes are re-activated), check out this interesting scientific article about The Genetics of Vitamin C Loss in Vertebrates.

Toxins: Counting by Weighing

For Lesson 75, students were challenged to identify a procedure to count large numbers of objects using only a small sample of those objects.  The lesson began with the Lesson 75 PowerPoint ChemCatalyst activity.  We worked through part A and then students were challenged to complete part B as homework for 5 points of extra credit.  Notes from the activity are pictured below:

IMG_0762

IMG_0764.JPG

Students then received the Lesson 75 Worksheet and worked together in small groups to come up with and enact a common procedure to count unknown numbers of toothpicks, pinto beans, Eppendorf tubes, pipette tips, lentils, and keyboard keys.  An abbreviated procedure  is in the picture above and class results (calculated and actual) are pictured below.

IMG_0763.JPG

Evolution: Evolution Game

Taking advantage of the beautiful weather, we spent the majority of class outside today playing an evolution game.  The class was divided into thirds, with one-third of students receiving a plastic fork, spoon, or knife.  All students received a cup.  The cup served as the “mouth” and the eating utensil was the “hand”.  Dried pinto beans were scattered in a section of the front lawn, and students had to move the beans from the ground to the cup using only the utensil.  After three minutes, the students gathered in their utensil groups and counted the total number of beans collected.  We repeated the activity again, changing the number of students with each utensil and collecting data for round two.  For the third and final round, students foraged for both beans and rice.  We then went back into the classroom and analyzed our results.   Students calculated the percentage of beans obtained by each group (percent of total collected for each round) and the average number of beans collected by the students in each group.  Students then brainstormed factors that could have affected class results and those are reported below:

  • Number of people per group
  • Beans blended into grass
  • Amount of hunting space around each student
  • Area chosen by student for hunting
  • Shape of utensil
  • Speed each student hunted
  • Some people cheated (used hands)
  • Technique (some used the utensil non-traditionally)
  • Determination of each student (persistence to hunt for full 3 minutes)
  • Competition for territory
  • Some utensils broke during the hunt
  • Shifting focus from beans to rice
  • Forks got caught on the grass
  • Hunters became more competitive
  • Amount of time available to hunt for food
  • Rough terrain affected food collection
  • Hunters sabotaging each other

The data for each class period is shown in the pictures below:

IMG_0755
Period 2
IMG_0757
Period 3
IMG_0759
Period 4
IMG_0761
Period 5

Toxins: Toxicity

In the first lesson of Chapter 14, students were introduced to the concept of LD50 (the dose of a compound that is lethal to 50% of the population).  Students considered the ChemCatalyst in slide 3 of the Lesson 74 PowerPoint, and also recorded the LD50 definition on slide 6.  Students then received both the Lesson 74 Worksheet and accompanying Lethal Doses Handout to work on during class.  For homework, students were assigned Lesson 74 textbook questions 4 and 5.  Example LD50 calculations from the whiteboard are pictured below: