
Students continued their learning about density by working through the ChemCatalyst starter activity included in the Lesson 51 PowerPoint and then working in small groups to complete the Lesson 51 Worksheet. Textbook questions 1-9 were assigned as homework.
Category Archives: Chemistry
Measuring Liquids
Students worked in small groups to complete the lab outlined in the Lesson 50 Worksheet. Before the lab, we reviewed the Lesson 50 PowerPoint slides that accompany the textbook reading. For homework, students were assigned textbook questions 5 and 7 from the end of Lesson 50.
Weather Science
We launched Unit 3 with an overview of how to make sense of the various types of weather maps used to predict weather.
To help connect the concepts of temperature, volume, and pressure, we began by watching Kevin Delaney performing on Jimmy Fallon:
The Lesson 49 PowerPoint, Lesson 49 Worksheet, and the Weather Variables handout are available for download. For more information about the jet stream, check out the short video below:
For weather forecast data, visit the University of Washington Atmospheric Sciences Virtual Map Room. Lesson 49 textbook questions 1-6 were assigned as homework.
Unit 4 Review
Pictures from the Tuesday edition of our Unit 4 Review:


Titration
We followed up our work yesterday with the Lesson 89 Titration Lab. Students received the Pre-Lab 89 Titration which we read through as a class. Students then took a few minutes to complete Pre-Lab assignment questions 1-4 which we briefly discussed. Students assembled into groups of 4 and worked through the lab. A picture of one group’s neutralized tubes is shown below, followed by results for periods 2 and 3, as well as combined results.

| Period 2 | Number of drops of NaOH | ||||||
| Team 1 | Team 2 | Team 3 | Team 4 | Team 5 | Team 6 | Average | |
| HCl Solution A | 20 | 10 | 10 | 10 | 11 | 14 | 13 |
| HCl Solution B | 20 | 25 | 20 | 19 | 18 | 18 | 20 |
| HCl Solution C | 60 | 56 | 61 | 62 | 56 | 69 | 61 |
| Period 3 | Number of drops of NaOH | ||||||
| Team 1 | Team 2 | Team 3 | Team 4 | Team 5 | Team 6 | Average | |
| HCl Solution A | 14 | 15 | 12 | 14 | 19 | 9 | 14 |
| HCl Solution B | 25 | 27 | 23 | 18 | 27 | 27 | 25 |
| HCl Solution C | 54 | 60 | 80 | 73 | 75 | 63 | 68 |
| Combined | Number of drops of NaOH | ||||||||||||
| Period 2 | Period 3 | ||||||||||||
| Team 1 | Team 2 | Team 3 | Team 4 | Team 5 | Team 6 | Team 1 | Team 2 | Team 3 | Team 4 | Team 5 | Team 6 | Average | |
| HCl Solution A | 20 | 10 | 10 | 10 | 11 | 14 | 14 | 15 | 12 | 14 | 19 | 9 | 13 |
| HCl Solution B | 20 | 25 | 20 | 19 | 18 | 18 | 25 | 27 | 23 | 18 | 27 | 27 | 22 |
| HCl Solution C | 60 | 56 | 61 | 62 | 56 | 69 | 54 | 60 | 80 | 73 | 75 | 63 | 64 |

Neutralization Reactions
For our first lesson back from Spring Break, we launched in to Lesson 88: Neutralization Reactions. Notes from the lesson are shown below:


Next, we conducted the lab in the Lesson 88 worksheet as a teacher-led demo (due to material constraints). For homework, students were assigned textbook problems 1-8 from Lesson 88.
[H+] and pH
We elected to take our time working through Lesson 86. We started the week with the Lesson 86 PowerPoint, connecting molar concentration of H+ or OH- with pH. Students then transitioned to the Lesson 86 Worksheet, working in teams to sort through the Acid-Base Solution Cards used in Lesson 85.
On Wednesday, we powered through the Lesson 86 lab, collecting pH data from 10 different solutions. Students did a fantastic job preparing concentrated stock solutions, diluting stock solutions, and measuring pH with our one functioning digital pH probe. Results from both classes are shown below, with second period results in green and third period results in red.

On Thursday, class began with students completing the Chemistry Textbook Pilot Student Survey. After the survey, we returned to the pH lab, analyzing our results in the context of a set of class notes (pictured below). We also practiced calculating pH from molarity and molarity from pH. Students were reminded that Google Chrome can be used as a calculator. Desmos.com offers a nice web-based scientific calculator as well.


We ended the week on a lighter note, celebrating National Teflon Day (April 6) with videos (and notes) about acids and bases that are so strong, their activities fall outside the traditional 0-14 pH scale.
Some additional videos that might be helpful:
Dude!
Homework Review
Before we dive too deeply into pH, we take today to brush up on unit conversion and scientific notation using the Unit Conversions 2 – Scientific Notation and Significant Digits Gizmo. Students who needed additional time and/or help with homework had the opportunity to work in small groups and with the teacher. At the end of class, students who want the opportunity to re-take the chapter 15 quiz received the Chapter 15 Quiz Retake Ticket as homework. The packet requires students to show their work as they solve problems and the packet must be completed correctly before students may retake the quiz. Students who want to retake the Chapter 15 quiz must do so after school on Monday, April 2.
Acid and Base Theory
We extended our learning about acids and bases by learning and applying the Arrhenius and Bronsted-Lowry definitions via the Lesson 85 PowerPoint, the Lesson 85 worksheet, and the Acid-Base Solution Card sort activity. For homework, students were assigned textbook problems #1-8 from Lesson 85.
Students who would like to further their understanding of Bronsted-Lowry acids and bases are encouraged to watch the Khan Academy video provided below:
Acids and Bases
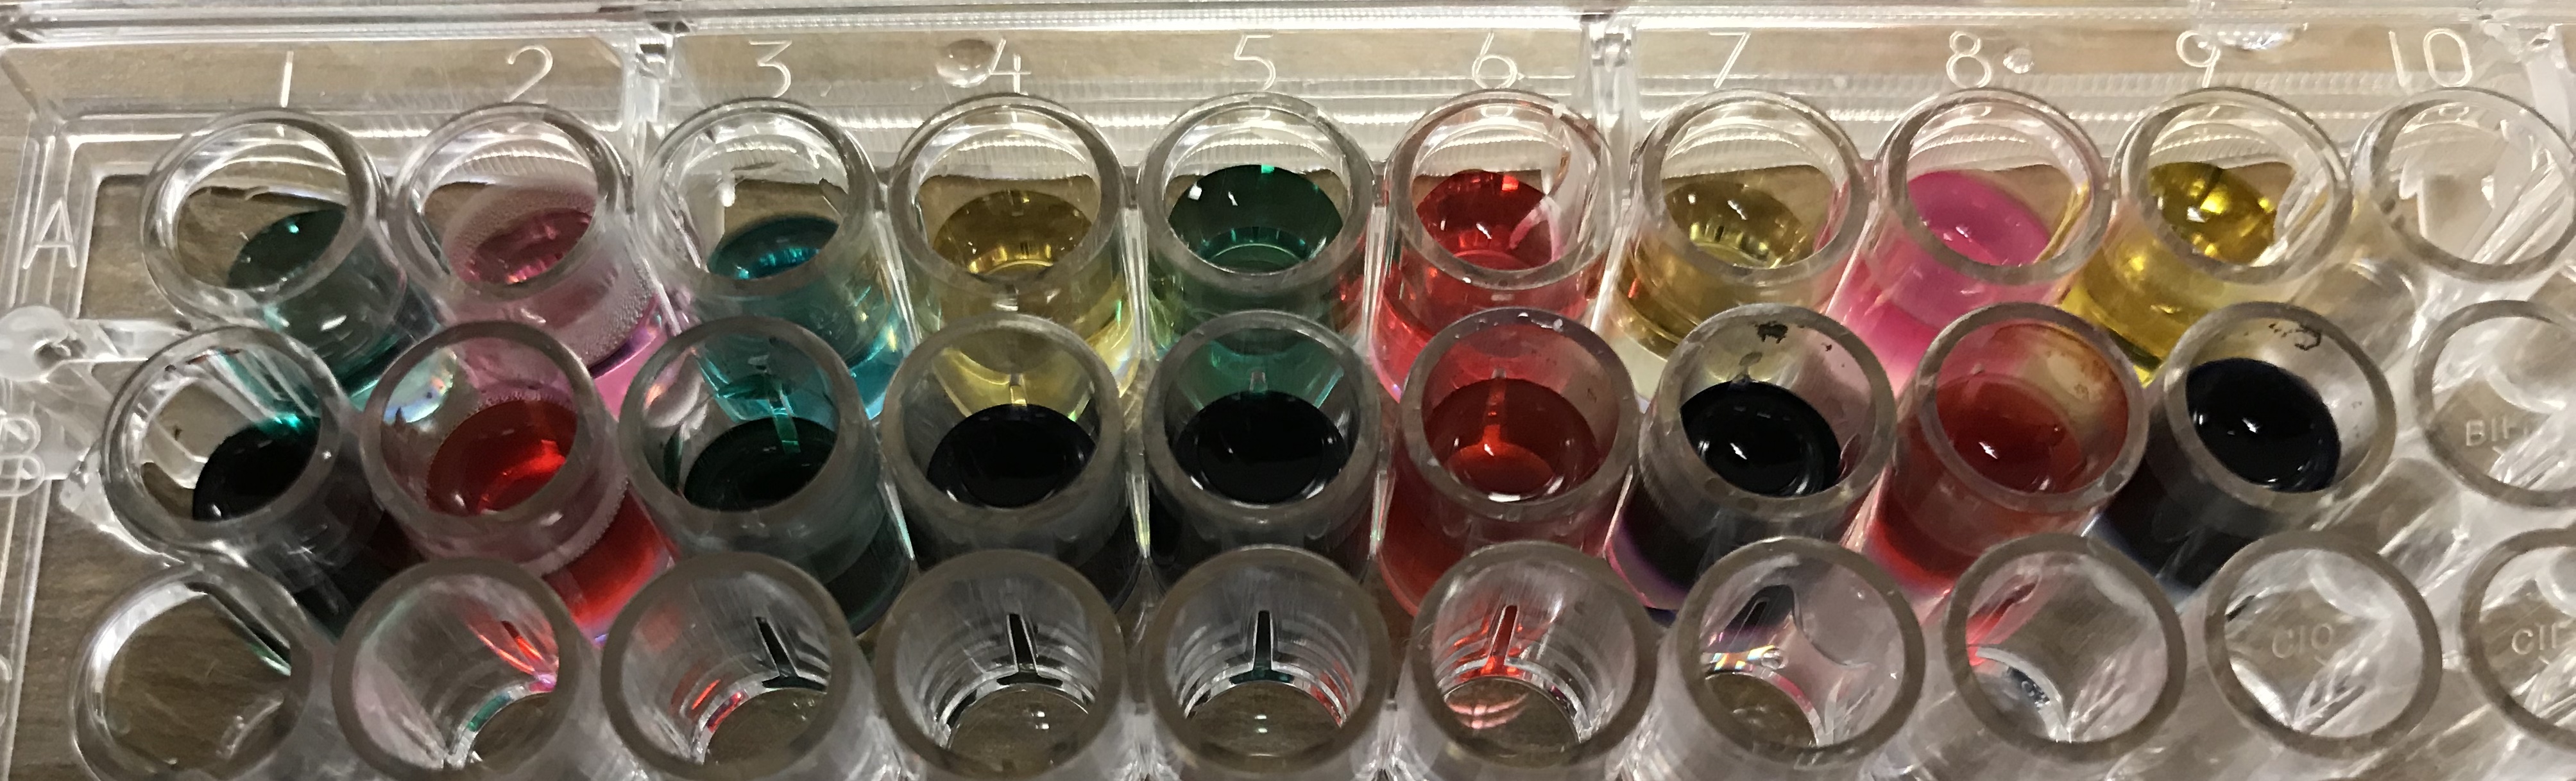
For the first lesson of chapter 16, students were formally introduced to acids and bases via a lab. We began class with the Lesson 84 PowerPoint which included a starter question helping students connect acid/base chemistry with the biology of heartburn. After learning about indicators, chemical solutions that change color in response to changes in pH, we reviewed the Lesson 84 worksheet. For Part 1, students were instructed to number the nine solutions in order, with the number on the worksheet corresponding to one of nine numbered flasks containing the indicated solution. An image of the lab setup is shown below:

After students complete the lab portion of Part 1, they were instructed to return to their seats to complete the Part 1 analysis questions. We will share out results as a class, and if time permits, conduct Part 2 as a teacher-led demonstration.
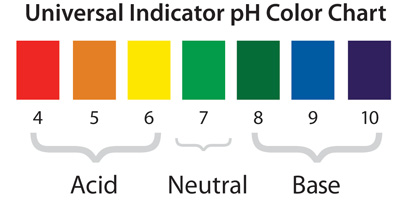

Example of student results with indicators – samples are arranged #1-9 in rows A and B, with cabbage juice indicator in row A and universal indicator in row B.
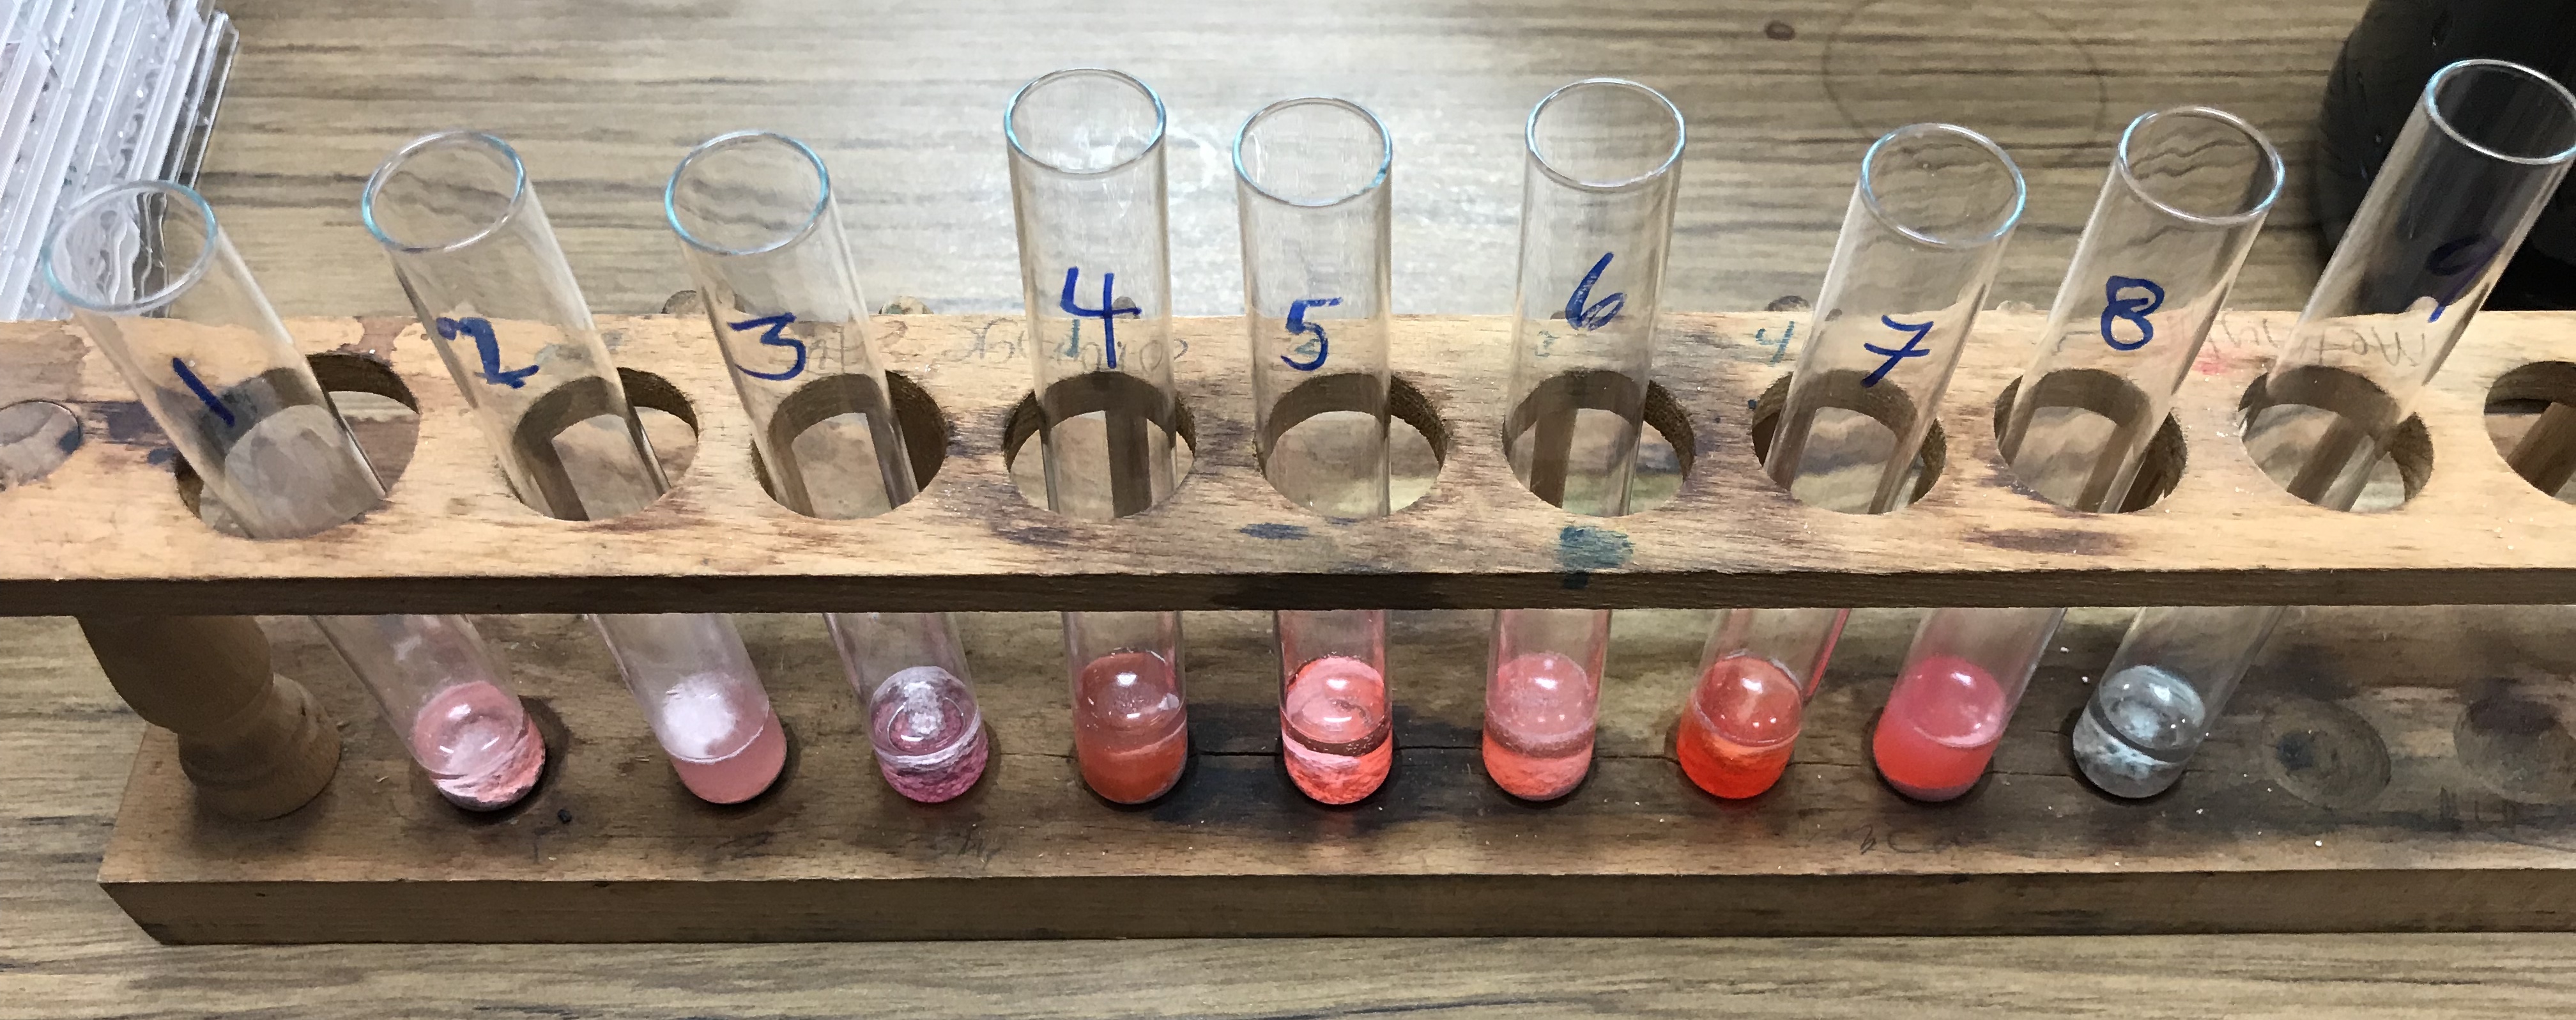
Results from the teacher-led demonstration for Part 2 are shown below:

You must be logged in to post a comment.