For Lesson 52, students conducted the DIY Thermometers Lab. For homework, students were assigned textbook problems #1-9. A picture of the liquid (antifreeze) thermometer setup is shown below:
Note: Tomorrow over half of each chemistry class will be attending the Shakespeare play, so students attending class will have time to complete homework.
With so many students out of class on a field trip on Friday, we switched the order of Lesson 52 and moved ahead to Lesson 53. We will return to Lesson 52 tomorrow after students have the opportunity to read through the lab and complete the pre-lab. Today, class began with a short SciShow video about the Kelvin Scale:
After the video, students worked through the Lesson 53 Worksheet. The worksheet refers to a simulation which can be accessed here: Gas Properties (PhET simulation which requires Java). The Lesson 53 PowerPoint is available for review by clicking here. For homework, students should complete textbook questions 1-7. Notes from class are provided below:
We began the week with a brief review of what to expect on the quiz scheduled for this Friday. Class notes are shown below:
This week, students will work in groups of three students each to create a poster representing biogeochemical cycling. For the project, students will create a poster to model the water, carbon, nitrogen, phosphorus, and sulfur cycles on a poster with an emphasis on including the ecosystem of Yellowstone National Park where possible. Students will have access to the class textbook and the class set of laptops to conduct their research. Students will also receive the Nutrient Cycling POGIL worksheet packet that will provide them with additional information about the process of carbon (C), water (H and O), nitrogen (N), and phosphorus (P) cycling. Sulfur is often included as a component of the biogeochemical cycle, frequently appreviated as the CHNOPS cycle. To help keep student projects moving forward, a variety of resources will be posted here for review.
Crash Course: Carbon and Water Cycles
Crash Course: Nitrogen and Phosphorus Cycles
Bozeman Science: Biogeochemical Cycles (includes the Sulfur Cycle)
The Global Carbon Cycle – a website with data about global carbon cycling with actual numbers that need to be added to the student posters.
Water Cycle – USGS website providing a robust review of hydrologic (water) cycle vocabulary, a presentation of the cycle itself, and data students will need to add the actual amount of water stored in various locations on Earth.
Texas A&M University has a website with pages devoted to explaining the Nitrogen Cycle. Additional in-depth information about the Nitrogen Cycle is available on the Nature Education Knowledge Project website.
Phosphorus Cycle – information about the cycle and a nice graphic from the Shmoop University website.
Sulfur Cycle – a presentation provided by The Environmental Literacy Council
In preparation for the mini-quiz tomorrow on Lessons 49-51, students had time to review the answer key for those assignments (click the hyperlinked questions in the List of Homework for Unit 3 page). Students had the remainder of the class period to study and ask questions about lesson content and specific homework questions. Final reminder: Turning in completed homework by the start of class Friday is required in order to take the mini-quiz.
After several days of research and reading, we lightened the mood with the Food Web Game. Students teamed up into groups of three, with each team receiving a container of rice. The rice represented seeds, which comprised the base of our food chain. One member of the team counted out 10 grains of rice and handed them to the runner who traded them in for one lentil. The recorder wrote a tally mark to indicate they had received a lentil on a note card. When the team reached 10 lentils, they traded those in for one white bean (representing a red fox). The game ended when the first team was able to trade in 10 white beans for one black bean and then all members of the team had to howl like a wolf. The game helped represent the energy it takes to sustain a single tertiary consumer, with energy loss represented by the energy students spent running back and forth during the activity.
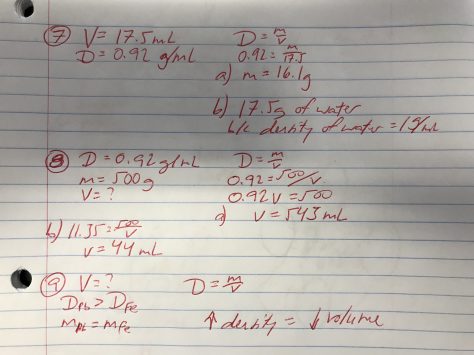
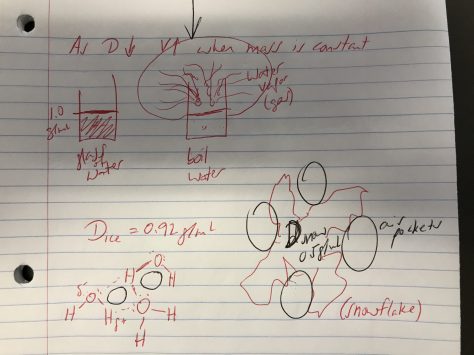
Students continued their learning about density by working through the ChemCatalyst starter activity included in the Lesson 51 PowerPoint and then working in small groups to complete the Lesson 51 Worksheet. Textbook questions 1-9 were assigned as homework.
In support of the House A Support Day, we elected to use class time today to complete the following work:
Yellowstone Trophic Pyramid (pyramid + food web handout along with trophic pyramid worksheet both due today)
Read the article titled “Interdependence Involves Limiting Factors and Carrying Capacity” on pages 650-652 of the BSCS Biology textbook. Take notes and define vocabulary in notebooks.
A limiting factor is anything that can slow, or limit, the growth of a population.
Biotic factors: food supply and other organisms
Abiotic factors: space, raw materials, climate (the prevailing weather conditions in a given area through long periods of time), light
Carrying capacity is the maximum population of a particular species that the habitat can support. It changes as environmental conditions change.
Population density is the number of individuals in relation to the space the population occupies.
Model photosynthesis using molecular modeling kits.
Sunlight + H20 + CO2 –> C6H12O6 + O2
To balance the equation, need 6 each of H20, CO2, and O2
We continued our study of the ecosystem of Yellowstone by introducing the concept of trophic levels. We worked through the Trophic Pyramid PowerPoint slide deck, emphasizing the vocabulary of producers and consumers, herbivores, carnivores, and omnivores. We took the population mass data from yesterday (see below) and began making sense of the data on the What are Trophic Pyramid handout (see below), the food webs students have been constructing, and our new understanding of trophic levels to construct a Yellowstone Trophic Pyramid.
What are Trophic Pyramids? (front)What are Trophic Pyramids? (back)
Students worked in small groups to complete the lab outlined in the Lesson 50 Worksheet. Before the lab, we reviewed the Lesson 50 PowerPoint slides that accompany the textbook reading. For homework, students were assigned textbook questions 5 and 7 from the end of Lesson 50.


You must be logged in to post a comment.