For the visual learners among us, the video below will help guide you through the process of conducting the research required to complete Slide 2.
An example layout of Slide 2 is pictured below.
Return to the Weeks 34-35 Toxin Research page.

For the visual learners among us, the video below will help guide you through the process of conducting the research required to complete Slide 2.
An example layout of Slide 2 is pictured below.
Return to the Weeks 34-35 Toxin Research page.
Last week, you were introduced to the concept of limiting reactants. In a chemical reaction, the limiting reactant is the chemical that is completely used up in the process of creating products. When the limiting reactant is gone, the reaction ends. Let’s imagine the chemical reaction of sodium bicarbonate (baking soda) and acetic acid (vinegar):
NaHCO3(s) + C2H4O2(aq) → NaC2H3O2(aq) + H2O(l) + CO2(g)
Let’s first notice that this equation is already balanced. It does not require any coefficients to have equal numbers of atoms of each element on both sides of the equation. One mole of solid sodium bicarbonate NaHCO3(s) reacts with one mole of aqueous acetic acid C2H4O2(aq) to produce one mole of aqueous sodium acetate NaC2H3O2(aq), one mole of liquid water H2O(l), and one mole of carbon dioxide gas CO2(g).
To determine how much of each substance we need to actually conduct this experiment, let’s calculate the molar masses of sodium bicarbonate and acetic acid:
Therefore, if we wanted to react one mole of sodium bicarbonate with one mole of acetic acid, we would need to combine 84.01 g of sodium bicarbonate with 60.06 g of acetic acid. Easy! We also know that we will produce one mole of carbon dioxide gas in this reaction – there will be bubbles! Thinking back to our work with gas laws in Unit 3, we know that one mole of any gas at standard temperature and pressure will occupy a volume of 22.4 L. So there will be a lot of gas bubbles! Here is the reaction:
What did you observe? Hopefully you noticed the geyser of bubbles – that was hard to miss! Did you also notice the white solid material at the bottom of the flask? That shouldn’t be there if the reactants fully reacted as expected. The science tells us that one mole of sodium bicarbonate will fully react with one mole acetic acid. Why was there so much unreacted sodium bicarbonate remaining? Why was acetic acid the limiting reactant in this chemical reaction?
To answer this question, we need to look closely at our reactant labels:
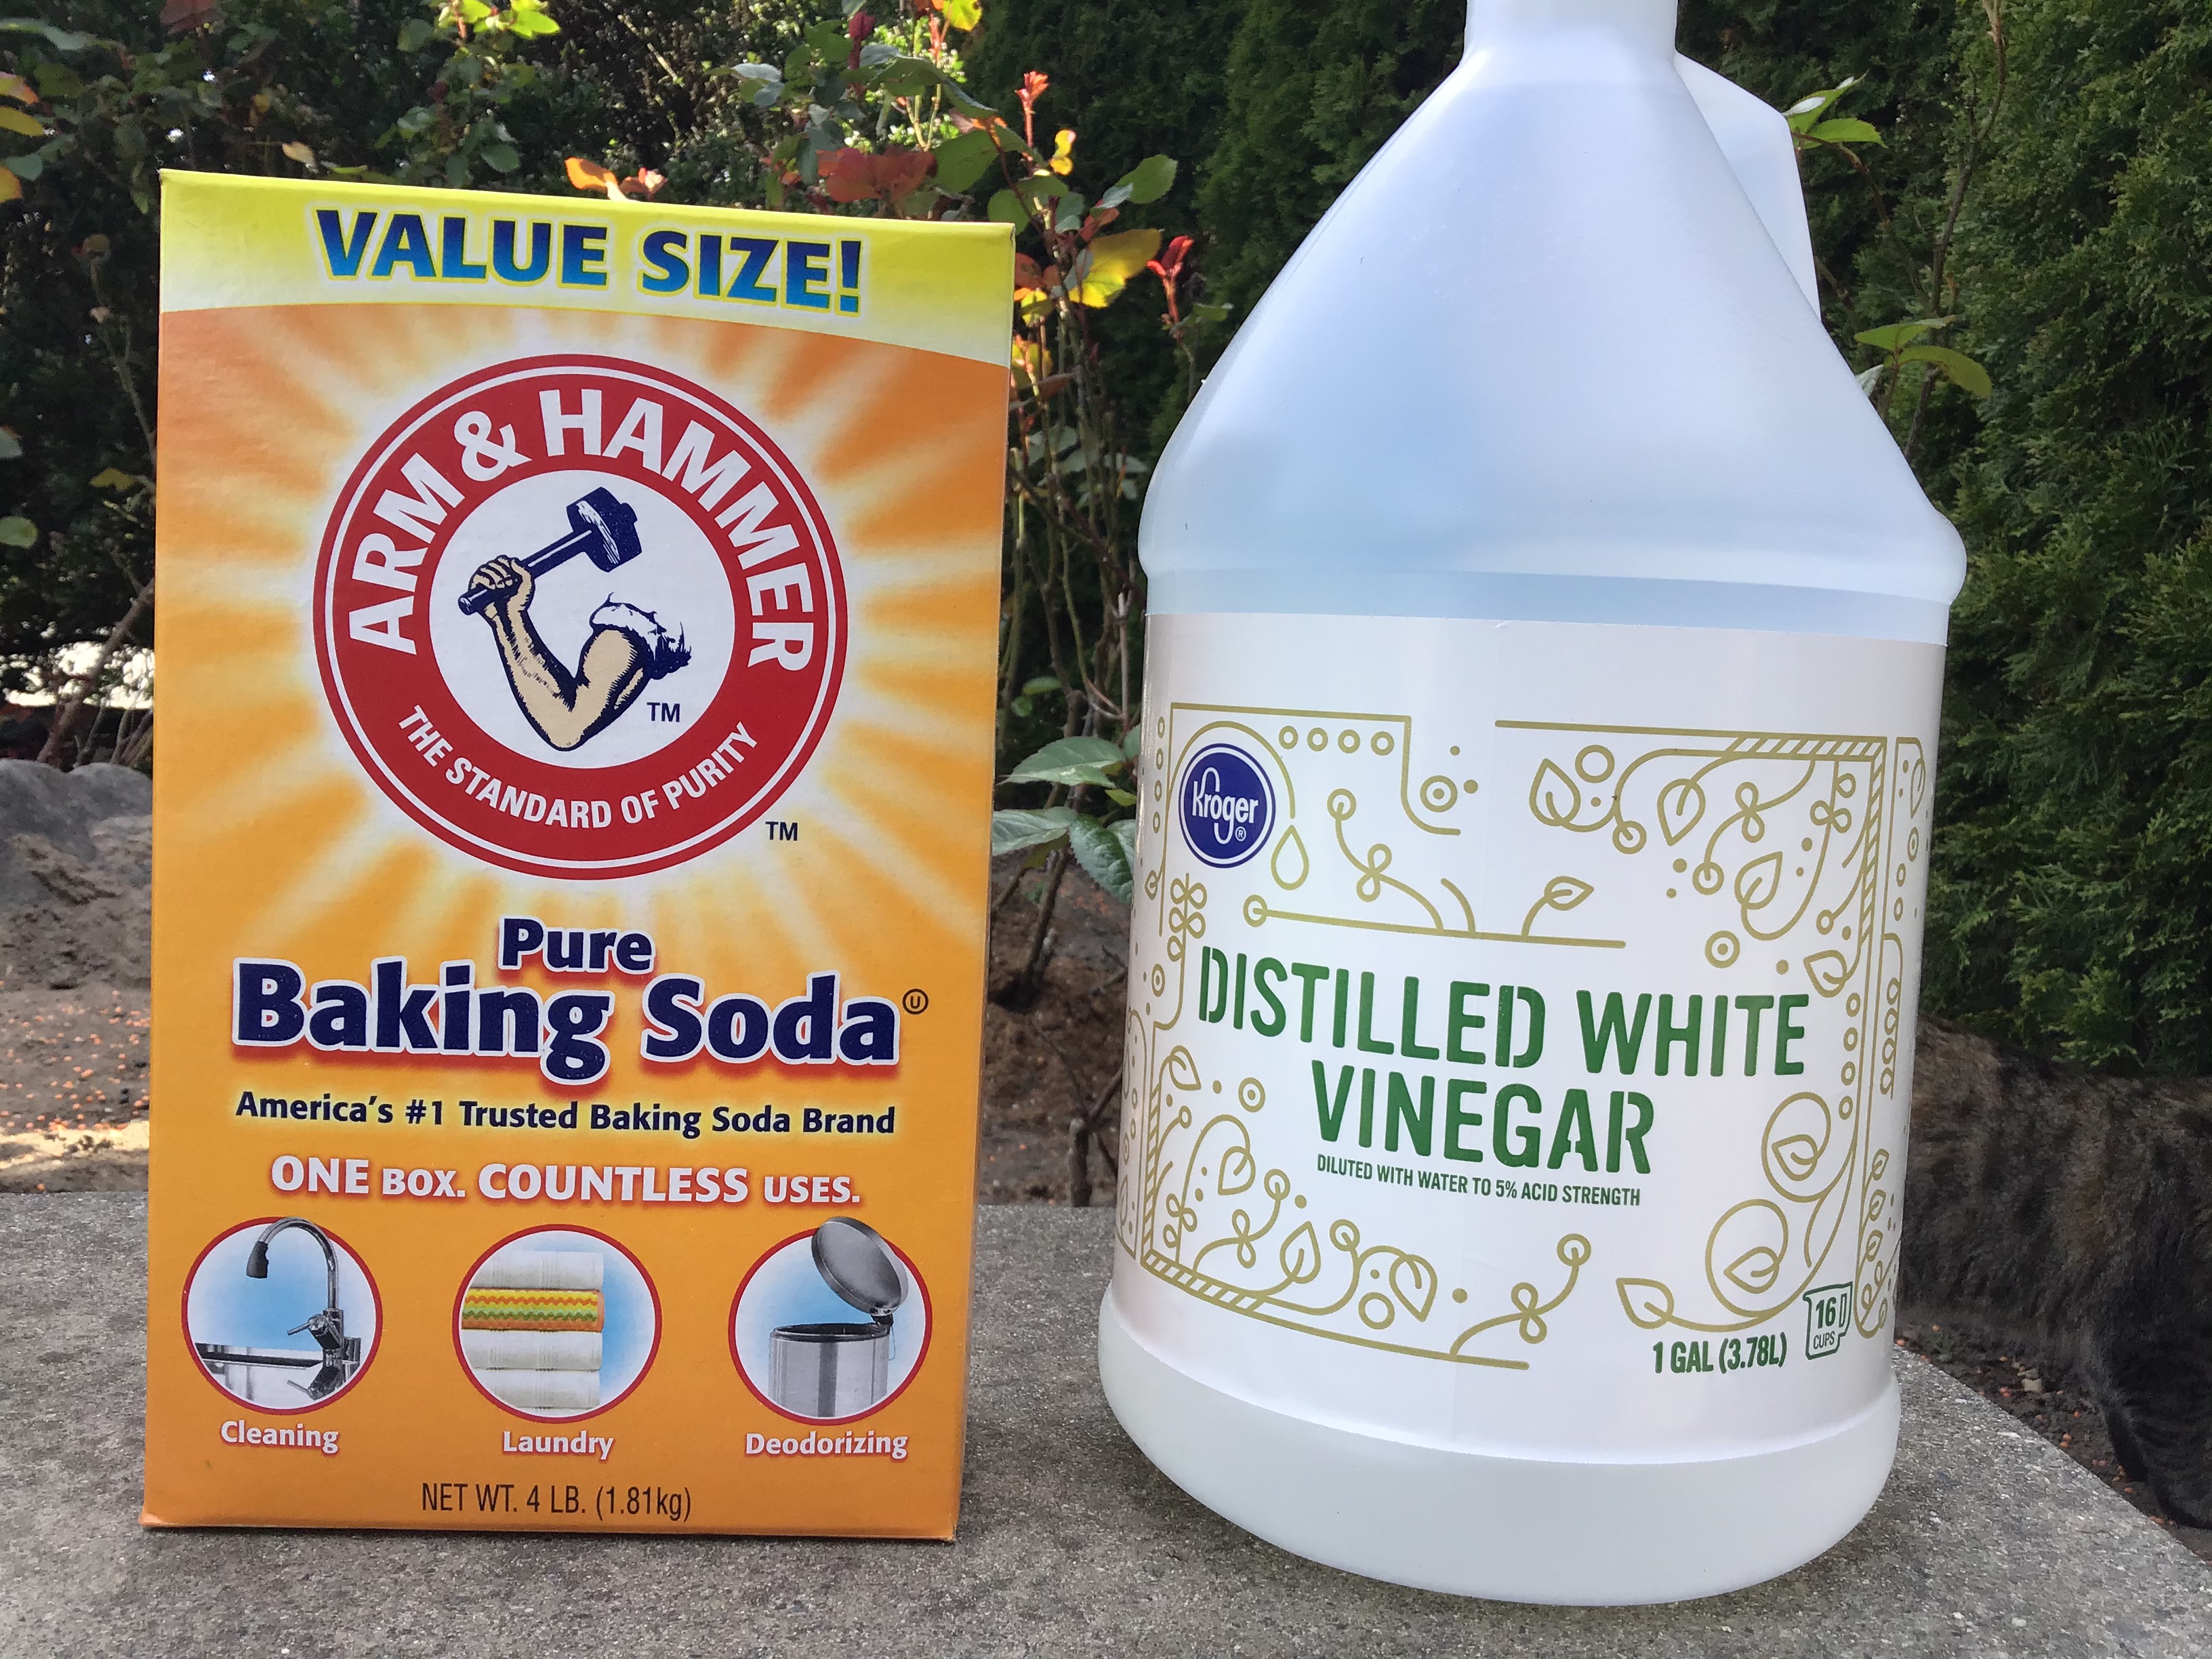
The baking soda is pure sodium bicarbonate. The distilled white vinegar has some fine print that says “distilled with water to 5% acid strength” – in other words, the distilled white vinegar actually contains 5% acetic acid and 95% water! In our balanced equation, we assumed we were using 100% acetic acid, not 5% acetic acid. Because 5% is 1/20 of 100%, we need to combine 20 times more of the 5% acetic acid (60.06 g x 20 = 1201.2 g) with 84.01 g of sodium bicarbonate to fully react both chemicals. Or, we could keep the amount of acetic acid the same (60.06 g) and use 20 times less of the sodium bicarbonate (84.01 g / 20 = 4.2 g). Let’s do that instead, to keep the amounts of each reagent reasonable:
What did you observe? Can you explain it? As we wind down the school year, this is an opportunity for you to earn credit in the lab report section of your chemistry grade. This is an optional assignment and will be worth 50 bonus points. If your grade is not where you want it, and your lab report scores have been less than amazing, this is your chance to make up a lot of ground. Please take advantage of it.
Lab Report Requirements:
Note: If you have access to baking soda and vinegar and a safe space to work, you are welcome to substitute your own experimental data for what you were provided above.
Need some help setting up your lab report? The links below will give you either a highly structured template specific to this lab, or a more generic template applicable to any lab report. If you decide to use either one, click the link and then select File > Make a Copy and get to it!
Finally, if you have read all the way down to this point, enjoy!
When finished, return to Weeks 34-35 – How Much Is Too Much? and continue working.
For the final research part of the Toxin Research Project, it’s time to answer the question: how much is too much? To answer that question, you need to research how much of your toxin is in a “standard dose” of your toxin. “Standard dose” can be hard to find, and is often provided as a range. For example, a “standard dose” of caffeine might be 100-200 mg per “dose” with a dose being an 8 ounce cup of coffee or a 12 ounce can of soda. In that case, split the difference and use 150 mg as the standard dose for caffeine. Buckle up – this is often the hardest part of this project. Be persistent! If “standard dose” doesn’t work as a search term, try “amount per serving” and see if that works.
Instructions for Slide 3:
Here’s a video of my efforts to determine the “standard dose” of capsaicin per jalapeno pepper:
Need help bring these concepts together? From the video above, we learned that the average jalapeño contains 2.24 mg of capsaicin. Here is an example calculation for how many jalapeños a 75 kg person would have to eat to reach the lethal dose for capsaicin (identified in Slide 1 as 47.2 mg/kg):
75 kg x (47.2 mg capsaicin / 1 kg) x (1 jalapeños / 2.24 mg capcaisin) = 1580 jalapeños
When finished with Slide 4, return to Weeks 34-35 – How Much Is Too Much? and continue working.
This week, you will be researching the question, How much is too much? To begin, we will consider the four ways we can be exposed to a toxic substance:
In the high school science lab, we have a variety of ways to minimize risk to exposure to toxic substances.
Your turn to show what you know. Complete the Routes of Exposure Google Form and then return to Weeks 34-35 – How Much Is Too Much? and continue working.
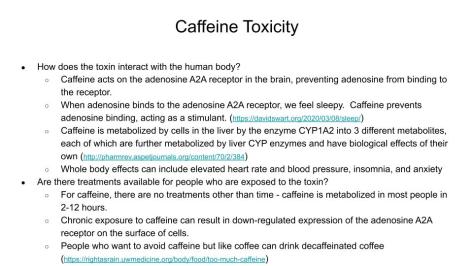
Toxicology is the the scientific study of the adverse effects of chemical substances on the living organism (Merriam-Webster). In Slide 1, you identified the chemical structure of a toxin molecule. In Slide 2, you will further define the biochemical properties of the molecule. To begin, click on the link in Slide 1 and return to the PubChem database entry for your toxin molecule.
Instructions for Slide 2:
Need help? You have options:
When finished with Slide 2, return to Weeks 34-35 – How Much Is Too Much? and continue working.
For the final slide of the Toxin Research Project, you will create a graph of the LD50 data from Slide 3. You have many different options for creating the line graph, some of which include:
Instructions for Slide 4:
Need help? Click here for an example of a graph created using Google Sheets.
You did it! Congratulations on completing the Toxin Research Project. Be sure to share your Google Slides with Mr. Swart at david.swart@g.highlineschools.org and you should also share your hard work with everyone at home!
When finished, return to Weeks 34-35 – How Much Is Too Much? and continue working.
For the visual learners among us, the video below will help guide you through the process of conducting the research required to complete Slide 1.
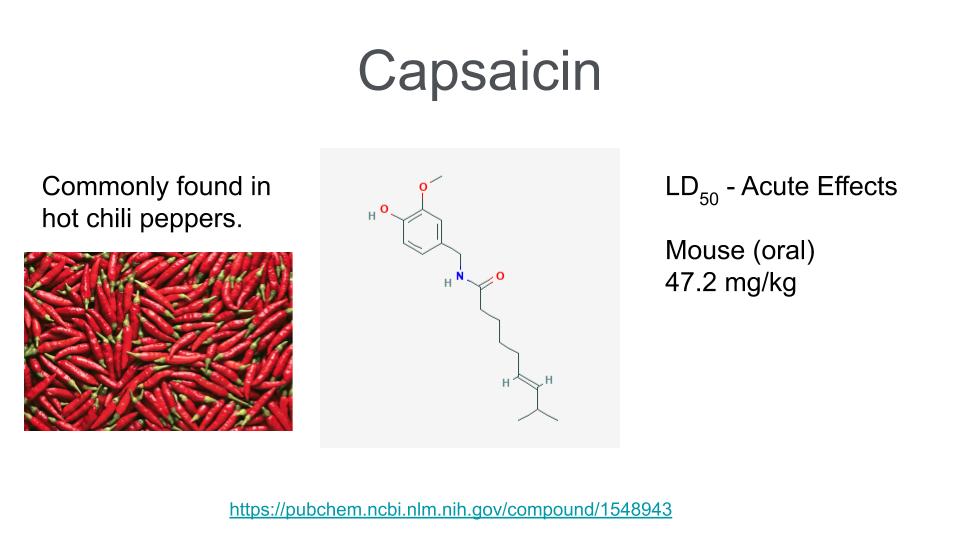
An example layout of Slide 1 is pictured below.
Return to the Weeks 34-35 Toxin Research page.
When we consider chemical exposure, it’s important to think about frequency: how often will exposure occur? Imagine you are at the gas station. It’s a warm day, and as you fill you fill your tank with gas, you smell the faint scent of gasoline vapor in the air. As you wrap up and put the nozzle back on the pump, a few drops of gas fall from the nozzle, thus preparing the scene for the next person. You just experienced an acute inhalation exposure to gasoline vapor.
Thankfully for you, it is a low-level exposure; you will be fine. For the attendant who has been working at the gas station for the last few years, every time they tidy up the pumping area (take out the garbage, change out the soapy water for washing windshields, sweep up litter, and spread kitty litter to absorb larger gas spills) they are experiencing chronic exposure to inhaled gasoline vapors.
When it rains, those drops of gasoline are washed down into the sewers and are carried out into Puget Sound. Fish swimming in the area come into contact with the gasoline, absorbing it through their eyes and skin and inhaling it through their gills. The gasoline evaporates when the weather turns sunny again, so the fish are only exposed for a few days (sub-acute exposure).
Birds in the area feed on the gasoline-exposed fish. It takes a few months for the birds to fully metabolize the gasoline ingested with the fish (sub-chronic exposure).
Your turn to show what you know. Complete the Types of Exposure Google Form and then return to Weeks 34-35 – How Much Is Too Much? and continue working.
Now that we understand some of the variables involved with evaluating exposure to toxic chemicals, it’s time to move forward with the Toxin Research Project. The first step is to decide which toxin you want to research. You are welcome to select anything of interest to you, as long as you can identify a specific molecule in the PubChem (NCBI) database AND you can find an appropriate LD50 for the molecule.
For inspiration, the websites below can help get you started:
For this part of your work, you need to create a Google Slides document. All of your Toxin Research Project work will go into the Google Slides. Instructions for completing this part of the work:
The molecule name, image, and LD50 for the molecule should all be found in the PubChem database. If you select a toxin from the list above, the linked article will provide you with information about exposure to the molecule. If you pick a toxin not on the list, you will need to do that research on your own.
Need help? You have options:
Finally, I would like to be able to post these online to share with each other. Please be creative in your layouts and make sure your name is not actually on the slide anywhere. Your name should only be in the title of the document. Have fun!
When finished with Slide 1, return to Weeks 34-35 – How Much Is Too Much? and continue working.
Welcome to Weeks 34 and 35! It is finally time to answer that age-old question: How much is too much? If I had a dollar for every time a student asked me, “Can I eat it?” after watching a chemical reaction in a lab…I could personally fund the Week 34 Bonus Credit Opportunity question (scroll way down to find it!). We all know the answer is always, “No food or drinks in the lab!” But why? This week, you will be able to find out for yourself. You have two weeks to complete this work. The recommended weekly work schedule is provided below. You must complete the weekly attendance check-in, but you are welcome to adjust the learning schedule to meet your own needs. Also, for anyone working on the Unit 4 Honors Project, this lesson comprises an important section of that project.
Week 34 (recommended)
Week 35 (recommended)
You did it! Just to make sure, here’s a checklist of items you must complete this week by Sunday, May 24 at 11:59pm:
Remember, you can email me any time. Office hours for Science are Tuesdays from 11am-12pm and Thursdays from 1pm-2pm. Check your student Gmail for Zoom instructions.
Don’t forget to complete the Week 34 and Week 35 Bonus Credit Opportunities! Check out the amazing artwork students are submitting as part of the Week 35 Bonus Credit Opportunity.

You must be logged in to post a comment.