Category Archives: Biology

Ecological Challenges

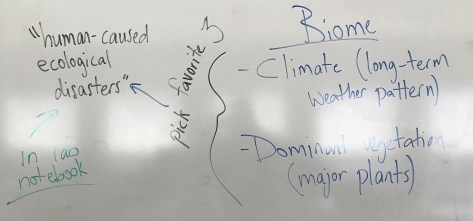
Our biome work continues today with students investigating the “human caused ecological disasters” they identified yesterday for the three biomes they selected.  Student groups will present preliminary findings to the class tomorrow.  Students should create one Google Slide for each of the biomes (one disaster per biome) and the slide should include as much of the following information as possible:

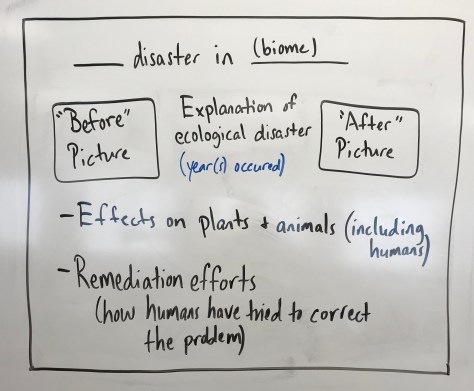
  • Year(s) the human-caused ecological disaster occurred
  • Description of biome pre-disaster
  • Explanation of what humans did to cause the disaster
  • Description of biome post-disaster
  • Effect of disaster on the plants and animals (including humans!)
  • Remediation efforts (how humans have tried to “fix” the damage)

Example of slide layout:

IMG_1925

A selection of resources are provided below:

SuperFund Sites in the USA

10 worst man-made environmental disasters

Earth’s Biomes

For our final section of the year, we end our study of Ecology first by studying the biomes of Earth, and then constructing models of the biomes complete with students solving a human-made problem found within each biome.

For our first day of work, students will assemble into groups of three students each.  Requirement: team members cannot have worked on a project together yet this year!

  • Step 1: Come up with a team name
  • Step 2: Select a unique color white board marker
  • Step 3: Given the definition of biome (a large naturally occurring community of flora and fauna occupying a major habitat, e.g., forest or tundra), race to list as many of Earth’s biomes as possible in two minutes
  • Step 4: Describe the key features of each biome, including
    • climate (the weather conditions prevailing in an area in general or over a long period)
    • dominant vegetation (plants)
  • Step 5: Select three biomes and research ecological disasters caused by humans.  Be prepared to share with the class.

Notes from the white board:

IMG_1919.jpg

Conclusion Writing

Reminder: Lab reports (one Google Doc per team shared with Mr. Swart), and the Plants Notes organizer (one per person) are both due Friday (May 25).  

Having acquired a deeper understanding of plant biology, we set our sights on the final piece of the Baggie Garden lab report: the Discussion / Conclusion section.  Remember, lab reports are organized into at least four parts in the following order:

  • Introduction (minimum of one paragraph)
    • State the scientific concept the lab is about.
    • Describe what you know about germination and how the lab is investigating the process of germination.  Include a discussion about how the energy used for germination is different from the energy used for plant growth.
    • State the hypothesis in if/then/because format for the experiment and then explain:
      • why this particular hypothesis was selected
      • how the experiment will add to your understanding of germination
  • Procedure:
    • Consists of a numbered list of steps
    • Each step includes one action
    • Must be detailed enough (including materials used) that someone unfamiliar with the lab could exactly repeat the experiment
  • Results
  • Discussion / Conclusion
    • Connect experimental results with Hypothesis.  Explain how the experimental design enabled you to test your hypothesis.
    • Explain how each manipulated variable affected the responding variable(s).  Be as specific as possible when describing the changes observed.  For example, as light intensity decreased from 200 lux to 40 lux (a decrease of 160 lux), the number of seeds germinating decreased from 80% to 40% (a decrease of 40%).
    • Explain how the data support your conclusion.  Regardless of whether your hypothesis was correct or incorrect, you now have data to help you better understand how the variable you selected impacts germination.  Explain that connection as thoroughly as possible.  By now, you may have read additional information about seed germination which may help you explain your results.  Include as much supporting evidence as possible from the sources you have examined.  If your results contradict what is published, explain how your results are different.  Provide a scientific explanation for the trend you observe in your data.
    • Provide a minimum of three possible sources of experimental error.  Explain how each possible source of error might influence the results your results.
    • Provide one opportunity to improve the experiment.  If you were to repeat this experiment, what would you do differently, and why?  Scientists work carefully and methodically, with experiments building on each other.  Think of your next experiment as the next step beyond your current experiment.

Seed Germination and Cellular Respiration

With our seed germination experiment coming to a close yesterday, students are taking a break from writing the lab report in order to add to their knowledge about plants. We began with a Crash Course video about vascular plants:

Next, each student was assigned to read pages 758-763 from the textbook Biology (Raven & Johnson, 4th Edition, 1996).  Students recorded definitions to vocabulary words and summarized sections using the Plants Notes organizer.  The organizer is due Friday, along with the Lab Report, and should help students improve Introduction sections and help support their writing of the Conclusion section later this week.

Data Analysis and Graphing

Today marks the final official day of data collection.  After collecting and recording Day 6 observations, students should complete their data table tracking how many of their seeds germinated.  Next, students should construct a data table showing how many seeds germinated as a percent of total seeds (per condition).  Finally, a graph of the percent germinated data needs to be made.  Both data tables and the graph need to be transferred to the Results section of the lab report.

The Results section should include a written explanation of what the data tables show.  Explain how each experimental condition affected seed germination, using the control bag of seeds as the comparison group.

Lab Report Checklist (how to know when you are done…for now)

  1. Introduction
  2. Procedure
  3. Results
    • Data Table #1 = # of seeds germinated
    • Data Table #2 = % of seeds germinated
    • Graph of Data Table #2
    • Explanation of what graph are (not what they mean)

Data Collection and Measurements

With the first week of our experiment coming to a close, students should return Monday with the following sections of their lab reports completed:

  • Introduction – at least one paragraph, perhaps two, filled with information about germination (hook your reader!) and explaining why you selected your manipulated variable.
  • Procedure – detailed enough that a stranger could repeat exactly what you did!
  • Results with Data Table – create the data table in Google Sheets.  Keep track of the number of seeds that germinate each day.  Then use your data to calculate the percent of seeds that have germinated.  You will create a graph of the percent germinated data next week.  Additional data collected will improve your report and result in an improved lab report score.

All team members must participate equally to writing the lab report.  Pictures are a great way to show your reader both your procedure and your results.  Pictures can go in the Results section and should be clearly labeled and organized.

Introduction Writing

In addition to efficiently observing seed germination, making measurements of roots and shoots, and recording all the data in Google Sheets, students should browse through the following resources:

Students should note whether the seeds used in their own experiment are dicots or monocots, and be prepared to explain the difference between the two.  Students should take careful notes about the optimal conditions for seed germination, focusing on the biology of the seed and especially the sources of energy the seed uses to germinate.

Next, students should work together to write the Introduction paragraph of their lab report.  The Introduction should include the following:

  • State (in a sentence or two) the scientific concept the lab is about.  Hint: germination!
  • Describe what you know about germination and how the lab is investigating the process of germination.  Include a discussion about how the energy used for germination is different from the energy used for plant growth.
  • State the hypothesis in if/then/because format for the experiment and then explain:
    • why this particular hypothesis was selected
    • how the experiment will add to your understanding of germination

Observations and Data Table

Today, we focused on identifying the experimental data to include in the Results section of the Baggie Garden Experiment lab report.  We compared the pros and cons of collecting lots of data with collecting a focused amount of data.  Students identified, discussed, and justified which experimental endpoints they wanted to collect for their experiment, and then created data tables in their lab notebooks to collect the data.  Finally, students made their first careful observations of their baggie gardens and recorded their observations.  We discussed how to calculate percentages so students can track the percent of their seeds that have germinated (notes below):

IMG_1839

Finally, students were shown an example spreadsheet created in Google Sheets.  The table below can be copied into Sheets and modified as needed:

Day 0 Day 1 Day 2 Day 3 Day 6
Control
Experimental Condition 1
Experimental Condition 2
Experimental Condition 3

The slide deck includes lesson content, including a link to the Chia Pet video which is also available below.

Setting up the Garden

Students established their Baggie Garden experiments today, setting up their experiment bags and one or more experimental control bags.  We began class with a brief overview of the day, and then students worked in groups to write a detailed experimental procedure.  Once their procedure was reviewed and teacher-approved, the students assembled their baggie gardens, using the resources available to test their hypotheses.

For groups testing temperature as their manipulated variable:

  • Freezer -10C
  • Refrigerator 9C
  • Room 23C
  • Warm box 30C

Tomorrow we will make our first experimental observations and then discuss how to organize how to collect and organize data relevant to each group’s research question.

Testable Experimental Variables

To extend our study of ecology, we will invest the next two weeks reviewing the scientific process through the lens of plant biology.  Our work today will involve identifying testable experimental variables associated with plant seed germination. Tomorrow, students will establish baggie gardens in order to test whether their selected variable impacts seed germination and/or seedling growth.  Our collective data will enable us to make detailed scientific observations and conclusions about factors affecting seed germination, seedling growth, and photosynthesis.  Along the way, students will practice the art of inquiry by:

  • identifying variables (manipulated, responding, and controlled)
  • writing hypothesis statements (using the if…then…because… format)
  • writing a detailed experimental procedure (incorporating the concepts of validity, reliability, repeated trials, and experimental control conditions)
  • recording, organizing, and analyzing detailed observations
  • writing a conclusion statement

Students will be expected to produce a typed lab report which includes a data table and a graph of the data.

Notes from class today:

IMG_1835