
With short periods today, students selected unit-articles to read from our vast collection of Scientific American magazines. Students wrote summary paragraphs describing each page of the article they read, with paragraphs consisting of the main ideas presented on the page, three things the student learned from the reading, and a list of vocabulary words for follow-up. Have a great weekend!
All posts by David Swart
Ecology and Systems Biology: Extreme Environments
Today we focused on 8 factors that are commonly found in environments we consider to be extreme. Students began the lesson with an introduction to the bell curve and an brief explanation of the mean and standard deviation. Students then silently brainstormed three examples of things they consider extreme, with an explanation about why. During our share out, students were encouraged to consider whether the idea of “extreme” is relative. For example, we might regard a skydiver as someone who participates in an extreme sport. However, the skydiver might share a different perspective. Similarly, we might classify a polar bear as an extremophile, given it’s ability to live in extremely cold temperatures. However, the polar bear, being unable to live comfortably away from the south pole, might consider organisms living in warmer climates as extremophiles. After learning about the 8 factors and exploring representative locations and organisms at those locations (see Power Point slides), students completed their extreme environments critter diagrams from yesterday.
Ecology and Systems Biology: Extremophiles
At the beginning of class yesterday, students were faced with the following scenario: You are an extreme environment engineer. Pick your next work assignment. The options were: The Ocean Floor, Olympus Mons (tallest known volcano in the solar system, located on Mars), Antarctica, and The Moon. Today, students were grouped based on their work site preference. Working in groups of 3 or 4, students then were assigned the extremophiles reading packet. Each group member was assigned a roles (slide 1), with the role rotating after each paragraph was read. The roles were: Reader, Paraphraser #1, Paraphraser #2, and Recorder. The Reader was responsible for reading the paragraph out loud to the group. The Recorder highlighted words that were challenging for the Reader or needed to be defined for comprehension. Paraphraser #1 was responsible for paraphrasing the main ideas they heard from the Reader. Paraphraser #2 paraphrased what they heard from Paraphraser #1, further distilling the key points down to a single sentence or two. Ultimately, those main points served as discussion points for answering the questions on the worksheet. The exercise served many learning purposes. Students practiced reading challenging scientific words and were supported by their group members who might be more familiar with the word or who could help the group find out the correct pronunciation and meaning. Students also practiced listening and paraphrasing, applying those skills to answer specific comprehension questions about extremophiles. Many students were able to complete the reading and turn it in at the end of class. Students needing extra time should complete the worksheet as homework and turn it in at the beginning of class tomorrow. At the end of the class period, students drew critter diagrams (slide 2) in their lab notebooks and filled out the leg corresponding to their chosen extreme environment. The legs represent extreme conditions encountered by life either currently living, or wishing to live, in the group’s extreme environment. Groups will share out their legs of the critter diagram tomorrow.
Ecology and Systems Biology: Great Salt Lake Initial Model
Today we turned our attention to the Great Salt Lake. We learned about the organisms that live in the lake, with students taking notes on a worksheet while we worked through a Power Point slide deck. Students learned that in a food web, organisms are drawn as nodes and the edges represent energy. The direction of the edge indicates the predator/prey relationship, with the arrow pointing away from the prey and toward the predator. Students then used the information from the slide deck to construct a food web on the initial model worksheet. Students had a lot of questions about using the initial model, and it’s important to keep in mind that the model of our understanding of the Great Salt Lake ecosystem will develop over time. Scientists often develop models with incomplete data sets and then use the gaps in their understanding to devise and test hypotheses. As scientists in training, we will also learn to work with incomplete data and we will learn to keep track of our questions and devise strategies for filling in the gaps in our knowledge.
Updated 9/30/14: We completed the initial model today, with students using scientific reasoning to assign units of energy moving through their food webs. Students turned in both the Power Point worksheet as well as the initial model worksheet at the end of class.
Ecology and Systems Biology: Clicker Quiz
We began the day with a quick video about the tardigrade (below). Then, students took their second clicker quiz of the year today. Questions included a review of the metric system, tools scientists use, ecosystem vocabulary, and a question about extremophiles. Have a safe and fun Homecoming!
Ecology and Systems Biology: Ecosystem Preview
Such talented students at Highline High School! With several students out of class today preparing for the Homecoming assembly, and short class periods, we reviewed the concept of ecosystem. We integrated biotic and abiotic factors (two vocabulary words learned yesterday). We defined an ecosystem as the biotic (living) and abiotic (non-living) factors present in a given space. We constructed a diagram of a model ecosystem, with students recalling that factors such as plants, animals, birds, insects, water, air, soil, rocks, buildings, mountains, and even the Sun can all be considered factors in an ecosystem. We characterized the various factors as biotic (for example, plants, animals, insects, and birds) or abiotic (for example, water, air, buildings, rocks, mountains, and the Sun). We discussed the fact that biotic factors are often found in direct contact with abiotic factors, and both types of factors are necessary for life as we know it. For example, bacteria are commonly found in all of the abiotic factors listed (except for the Sun!). We then watched the first 16 minutes of episode 6 of Neil deGrasse Tyson’s Cosmos series. In the video segment, Dr. Tyson explores the ecosystem of a dew drop. We were introduced to the tardigrade – an instant class favorite! Season 1 of Cosmos is currently available streaming on Netflix.
Ecology and Systems Biology: Networks and Factors
We launched our first lesson of Unit 2 (Ecology and Systems Biology) with an introduction to the SQ3R reading strategy. Details are included in the attached slide deck presented to students before they practiced the SQ3R reading strategy on a reading passage. The reading introduced students to the vocabulary words of biotic factors (living things) and abiotic factors (things that are not living), and related both types of factors to the study of systems. Students who were unable to complete the reading in class should finish it as homework and turn it in at the start of class tomorrow morning to receive full credit.
Nature of Science: Unit 1 Wrap-Up
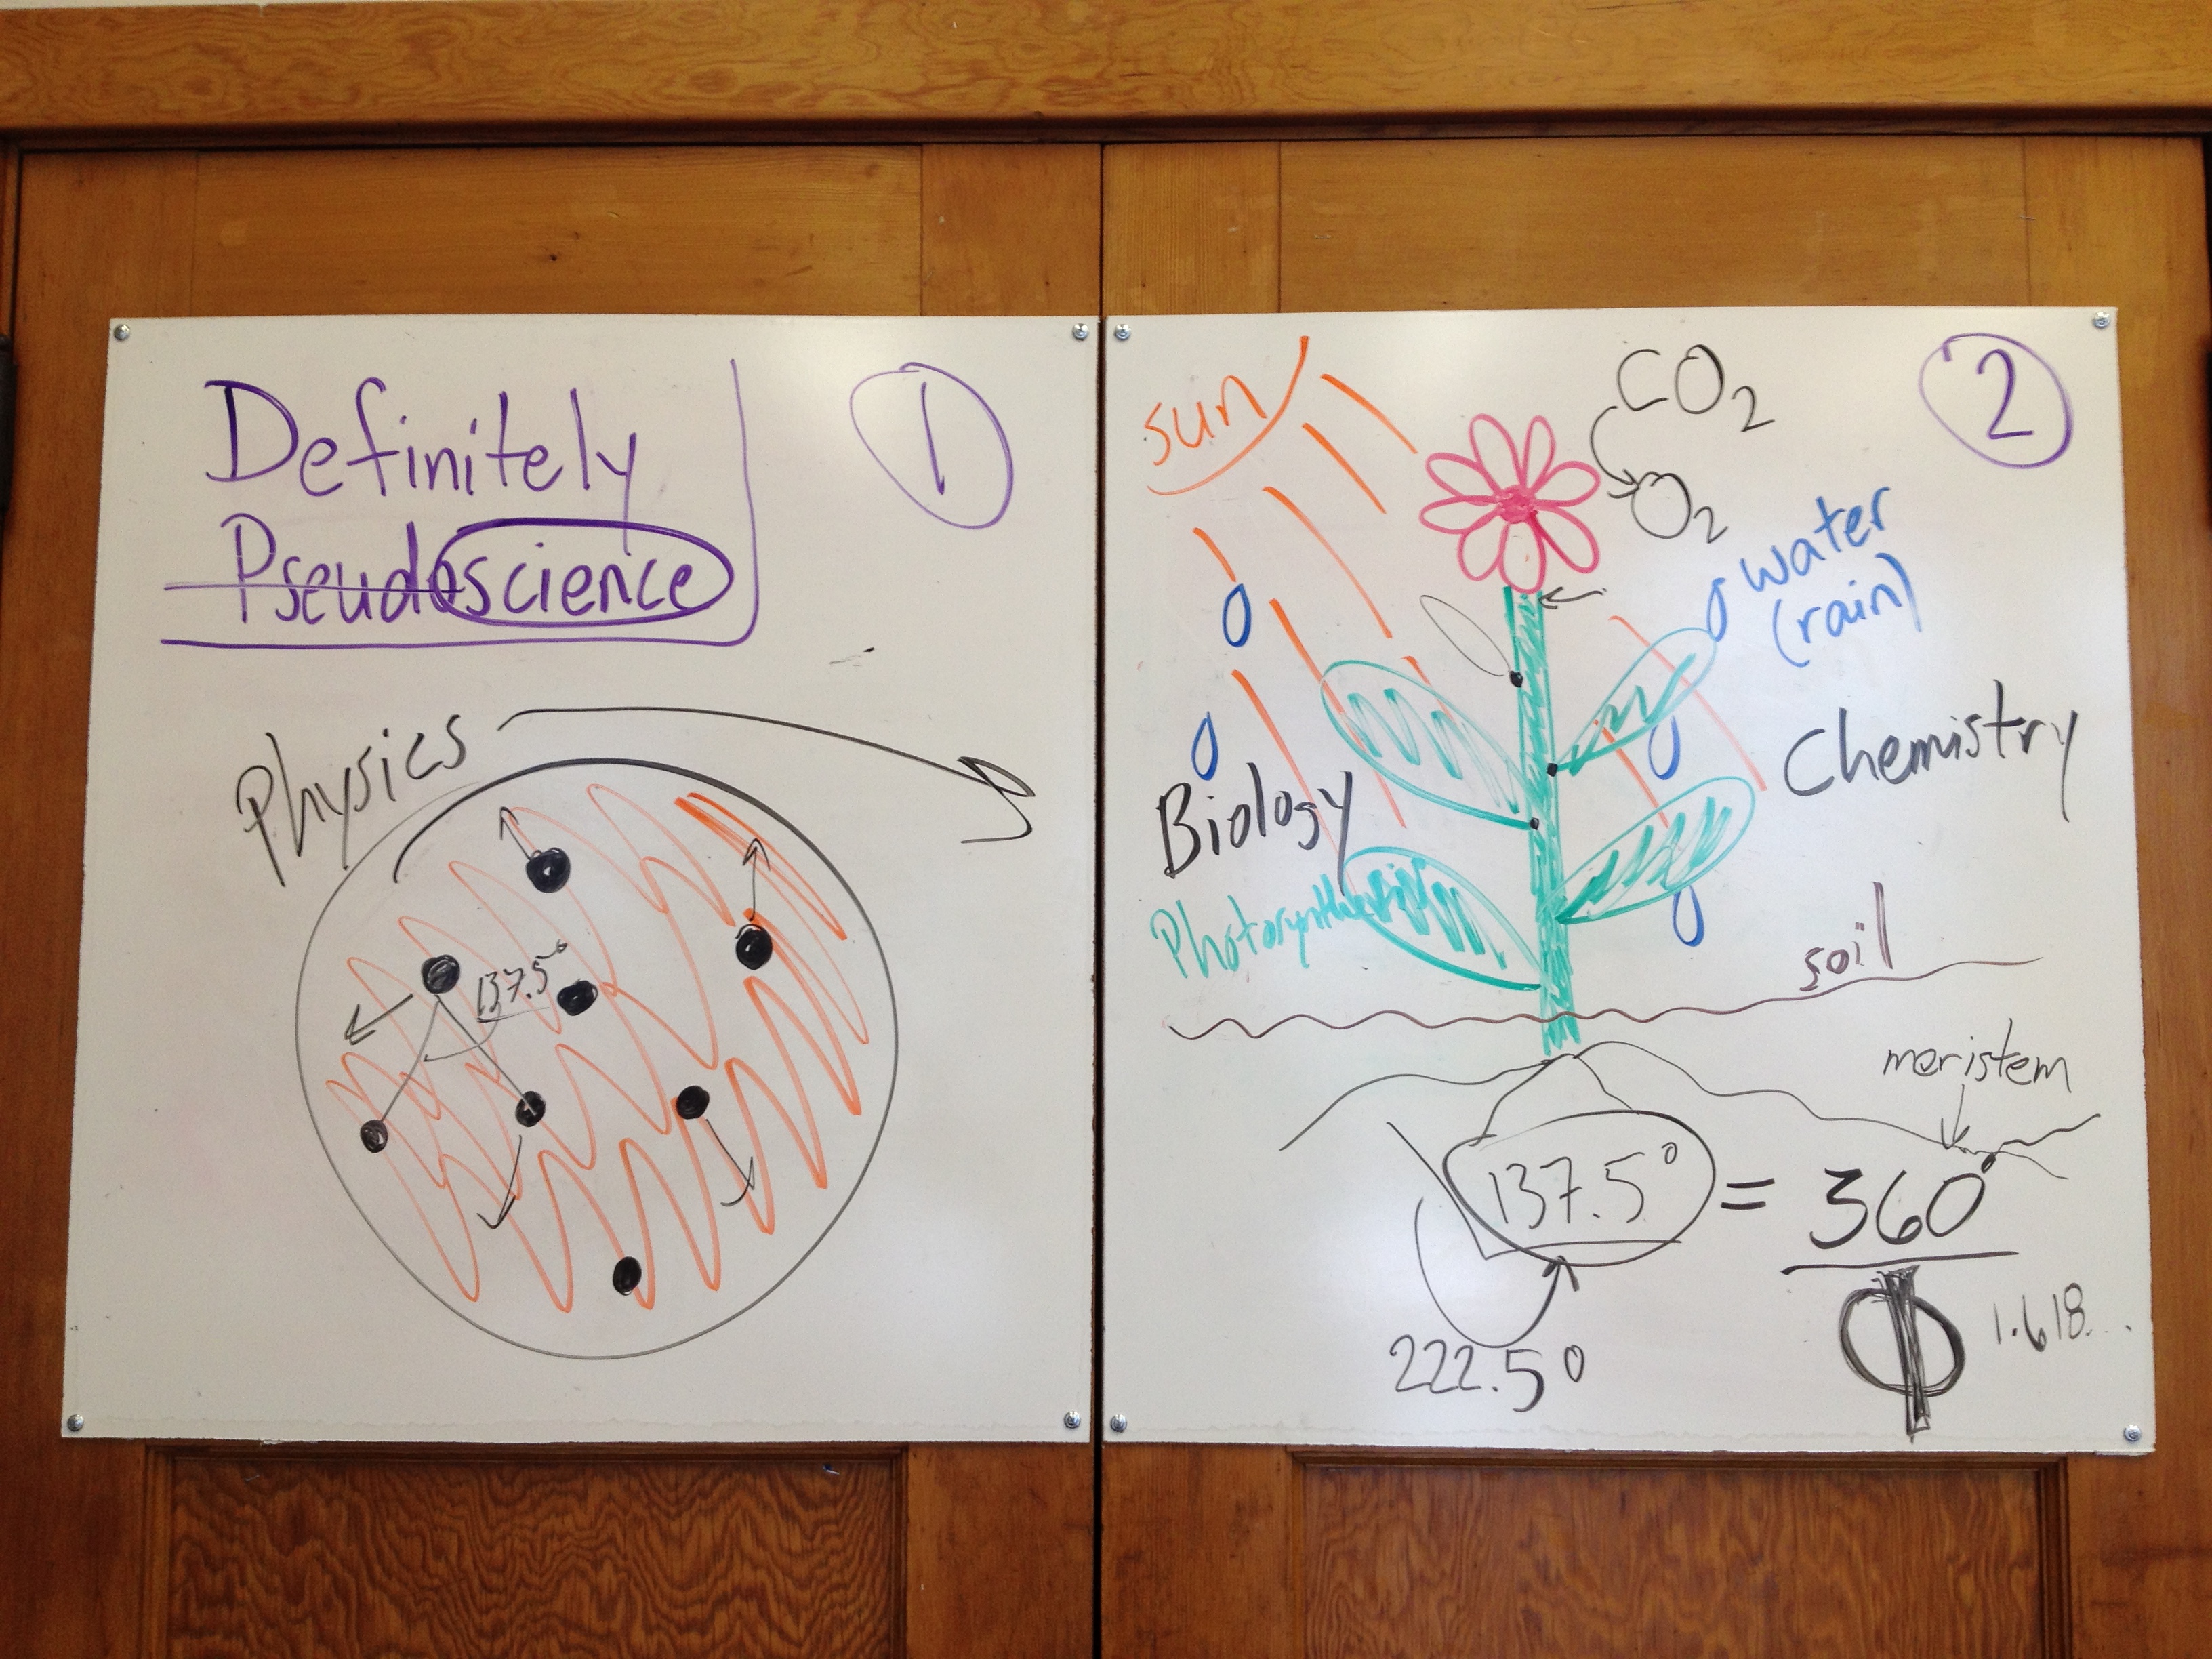
We brought Unit 1 to a close by revisiting the Golden Ratio. Students were introduced to the concept of “respectful scientific discourse” and practiced sharing their thoughts about whether the Golden Ratio should be considered science or pseudoscience. Students practiced discourse in groups of 4 multiple times throughout the period. Between group discussions, we revisited the Golden Ratio. Students re-watched a segment of the first video (below) and we discussed the effect of the video production (music, narration, images) on their perception of the Golden Ratio as science or pseudoscience. Students were reminded of the Bill Nye video we watched where they learned that practitioners of pseudoscience often play on our senses and our emotions to try and earn our trust (and our money!). We then watched a video by Hank Green (SciShow), where the Golden Ratio is presented in a style that might be seen as more credible than the first video. We concluded the lesson either by watching video segments by Vi Hart (see the September 21 post), or more comprehensibly for the students, through an artistic representation by the teacher, of how the Golden Ratio manifests in plant growth through the actions of hormones. As our understanding of plant hormones and genetics grows, it would appear the Golden Ratio is in fact firmly grounded in science, as least with respect to plants.
Video 1
Video 2
Final Model – Teacher Drawing
Nature of Science: Milk Lab Analysis
We concluded the Milk Lab with an analysis of the summaries prepared by my five classes on Day 2 of the Milk Lab. Students worked in groups of 4 and analyzed the consistency (and inconsistency) of results reported in 5 summary tables. By working in teams and analyzing results from similar experiments performed by students in other classes, we simulated a scenario scientists practice routinely when evaluating how their own results compare with what is reported in the scientific literature. We then discussed the results of the analysis in the context of the Milk Lab Explanation document. We ended class with a quick unit conversion problem. We worked through the question: how many seconds are in one day? The answer:
24 hours / 1 day x 60 minutes / 1 hour x 60 second / 1 minute = 86,400 seconds / day
Nature of Science: Number Series in Nature
The plan this week is to wrap up Unit 1: Nature of Science, and transition to Unit 2: Ecology and Systems Biology. We began Unit 1 with the Milk Lab, and tomorrow we will take some time to revisit the results observed across my 5 classes. Students will work in small groups to devise strategies to organize the results. Students will also receive an explanation about why the food coloring swirled the way that it did after addition of soap to the various types of milk tested. If time permits, we will also practice a few simple unit conversion math problems to help students develop the skills needed to complete the math worksheet from last Tuesday.
The reason for this weekend post is actually to give interested students a chance to preview a few videos before Tuesday. In that lesson, we will practice “respectful scientific discourse” in the context of a class debate around the Golden Ratio. Students learned about the Golden Ratio from a video we watched in class, and in lessons the following two days, we watched additional videos which presented the concept of pseudoscience. The sequencing of these lessons was intentional, and many students seem to agree that the Golden Ratio can be viewed as pseudoscience. On Tuesday, students will watch another video that explains the Golden Ratio in a different light. In the video, the presenter refers viewers to a series of videos by Vi Hart. I strongly encourage students to take the time to watch these videos. She speaks quickly, but the content is fascinating and just might make you question your position on the Golden Ratio.

You must be logged in to post a comment.